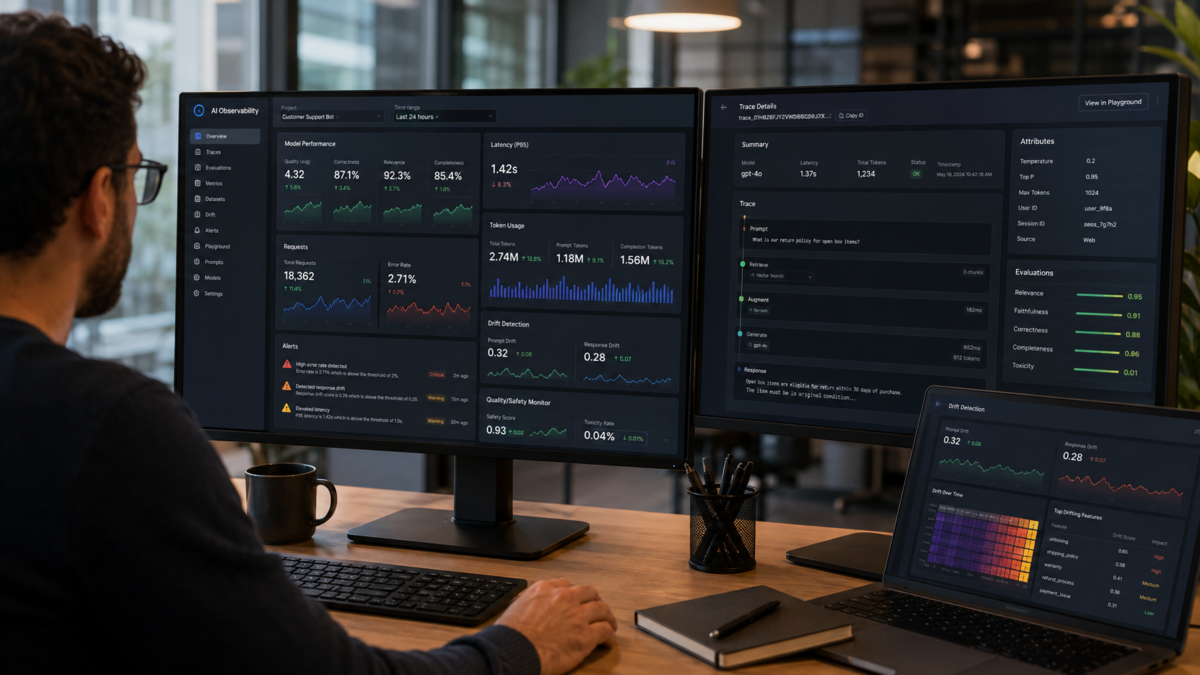
There’s a lawyer in the United States who cited several court cases in a legal brief and was sanctioned by the court shortly after. The reason was simple: most of the cases he cited never existed in the first place. They were fabricated, and he had submitted them to the court after taking AI-generated information at face value. The High Court of England later warned that lawyers who use AI-generated false material in their arguments could be prosecuted for contempt of court, and there have been several reported cases of courts ordering lawyers to pay opposing costs or referring them for disciplinary action to regulators such as the SRA and the Bar Standards Board. What’s worth noting here is that even as the AI produced a completely wrong answer, not a single error appeared in the system logs.
A survey released this year found that 53% of engineering teams spend more than 40% of their working hours on incident response, and 40% of the organizations surveyed said a significant share of their engineering time goes toward managing incidents. A system that looks fine on the surface while quietly failing underneath: the industry calls this a “silent failure.” AI Observability is the concept built to tackle this problem head-on.
Gartner predicts that by 2028, 40% of organizations that have adopted AI will be using dedicated AI observability tools. The related market is expected to grow from $1.97 billion in 2025 to $2.69 billion in 2026, reaching $9.26 billion by 2030. In this article, we’ll walk through what AI observability actually is and how you can put it to work, focusing on what matters most.
What Is AI Observability and Why Traditional Monitoring (APM) Falls Short
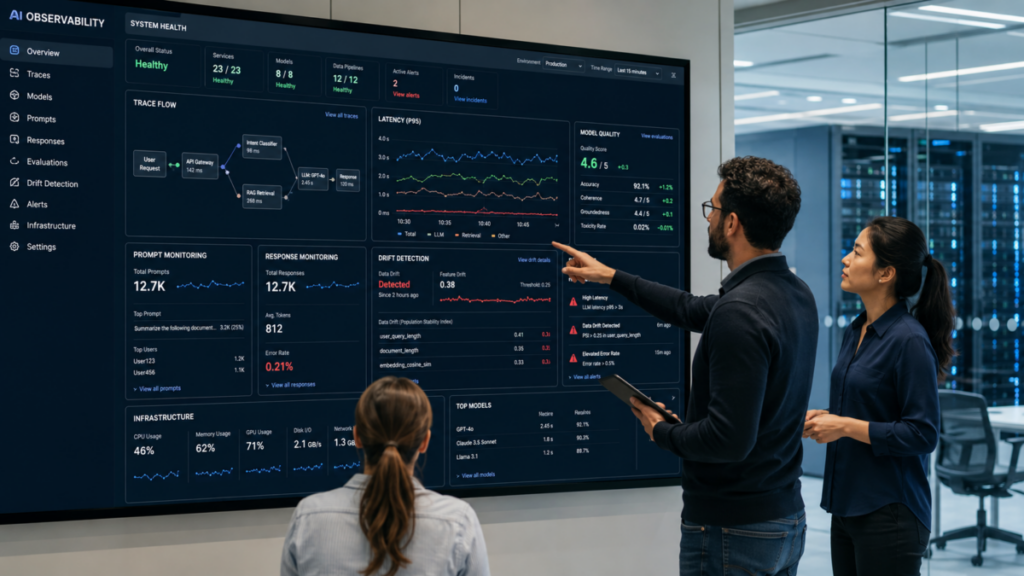
AI observability is an operational framework that lets you see, in real time, what an AI system in production, especially an LLM or AI agent, is doing right now, why it produced a given result and whether that result meets your expectations for quality, stability and cost.
Put simply, it’s not about wiring AI into your service once and walking away. It means continuously watching what answers the AI is giving right now and checking whether those answers actually hold up. Hiring a new employee doesn’t mean you stop paying attention to them afterward. You keep an eye on whether they’re doing their job properly and catching their mistakes. AI observability plays that same role for AI.
Where traditional APM (Application Performance Monitoring) focuses on confirming that the system is still alive, AI observability goes a step further. It needs to be able to explain why the system made a particular decision.
If that sounds complicated, it comes down to whether you can answer three questions.
- What is happening right now (what request is the AI handling)
- Why did it act that way (what reasoning or path led to that answer)
- Is it behaving as expected (is it meeting your standards for quality, safety and cost)
Traditional monitoring could only really answer the first question. What sets AI observability apart is that it needs to answer all three.
Gartner VP Analyst Padraig Byrne has noted that, unlike traditional software, AI’s decision-making process is often hidden, making it hard to explain or trust, and that when something does go wrong, it can lead to substantial financial loss, reputational damage and regulatory scrutiny, pointing to how AI’s opaque decision-making structure becomes a business risk in its own right.
One question comes up a lot at this point: how is this different from MLOps? Here’s a simple way to think about it.
- MLOps: everything involved in building and running the factory
- AI observability: the quality control line that inspects every single product coming off that factory floor in real time
In other words, if MLOps is the broad discipline covering everything from training and deploying models to managing versions, AI observability is the narrower slice of it focused on watching and evaluating whether a model that’s already serving real traffic is working well right now.
As the American lawyer’s story showed, an LLM can produce completely wrong information with total confidence, and the industry generally agrees that this isn’t an occasional bug but a structural trait of the technology itself. If that’s the case, the realistic goal isn’t eliminating hallucination entirely. It’s knowing exactly when, where and how often it happens, and managing it accordingly. That is the reason AI observability exists.
Let’s make this more concrete. When a server goes down, an alarm goes off and someone’s phone lights up with a text message, because it’s a visible failure. But what happens when the AI wrongly tells a customer they’re eligible for a refund? The server is fine, response times are normal and no error alarm goes off. The only way anyone finds out is if the customer complains directly or someone happens to scroll through the conversation log. This is exactly why AI observability matters: it turns a structure where you only find out after something has gone wrong into one where you can catch it before it does.
The table below summarizes the difference between the two approaches.
| Category | Traditional Software Monitoring (APM) | AI Observability |
|---|---|---|
| Failure pattern | Deterministic (same input leads to same output) | Probabilistic (same input can lead to different output) |
| Detection method | Error codes, exceptions, response delays | Semantic failure (looks fine on the surface, wrong underneath) |
| Typical problems | Server outages, response delays, memory leaks | Hallucination, prompt injection, quality degradation |
| Key metrics | CPU/memory, response time, error rate | Accuracy, relevance, safety, token cost |
The Four Pillars of AI Observability
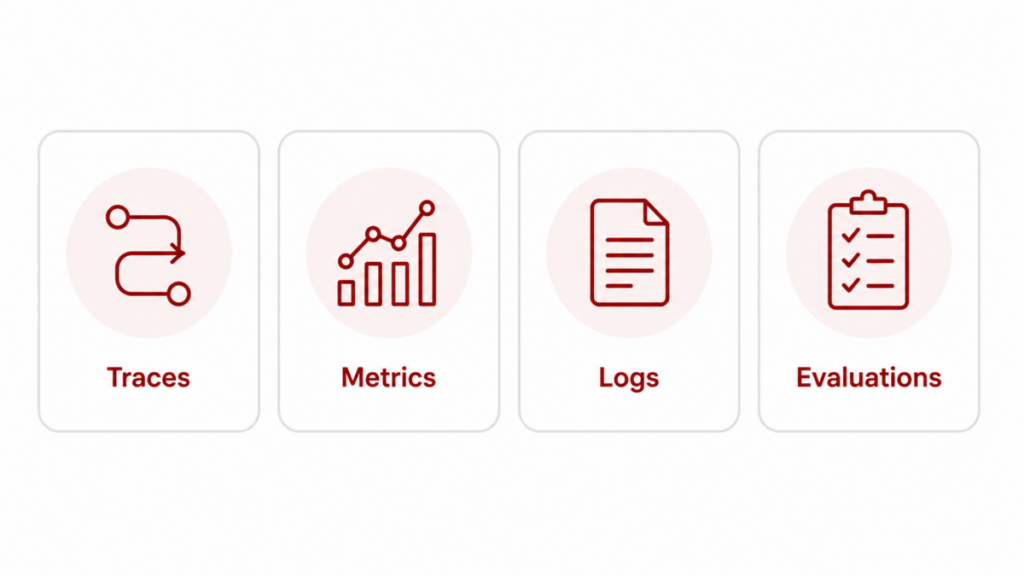
AI observability is typically built on four elements: traces, metrics, logs and evaluations. The reason you need all four is simple: each one answers a different question. Traces tell you what happened, metrics tell you whether something looks off right now, logs tell you whether you can explain it later and evaluations tell you whether the answer was actually correct. Miss even one of these, and you’ll have no way to trace the root cause when something goes wrong.
- Traces: a record of the exact path a single customer question took before it turned into an answer
- Metrics: numbers that show, in the moment, whether the service is running well today
- Logs: evidence you can go back to later and check exactly what happened
- Evaluations: a report card on whether the AI’s answer was actually right
Say a customer asks a chatbot, “Can I get a refund on something I bought last month?” A trace shows, step by step, how that question moved from the chatbot through an order lookup and a search of the refund policy documents before arriving at a final answer. If the system pulled up the wrong document at any point along the way, opening the trace tells you exactly where things went wrong. Without it, whoever’s on call has no way to explain why that answer came out.
Metrics look at the overall pattern rather than any single incident. They continuously track, in numbers, whether response times have slowed down compared to usual or whether costs have suddenly jumped since a particular feature shipped. Catching an anomaly here means you can notice trouble before it turns into a real outage.
Logs are the evidence that lets you explain, after the fact, why a given answer came out the way it did. In heavily regulated industries like finance or healthcare in particular, these logs are often the only thing you can point to when something goes wrong. That’s why it’s safer to work out how long to retain logs and who gets access to them together with your legal and compliance team from the very beginning.
Evaluations, finally, are about continuously grading whether answers are actually correct. Here are the criteria most commonly used in practice.
- Faithfulness: does the answer actually rely on the source material it was given
- Relevance: does it actually answer what the user asked
- Safety: is it free of harmful or biased language
- Cost efficiency: can you get the same quality for less
How far you go with each of these four, and how strictly you enforce them, varies from company to company. Most practitioner guides agree on one thing: there’s no single right answer here.
There’s one more thing worth watching here: the data coming in. The model itself might stay exactly the same, but the questions people ask or the reference material available can shift gradually over time. This is called data drift. In RAG systems especially, where answers are built by retrieving relevant documents, the same question can pull up different documents over time, quietly changing the character of the answer itself. The tricky part is that this shift happens very slowly. FutureAGI has warned that prediction quality can quietly degrade over weeks without anyone noticing, underscoring how data drift builds up without ever showing on the surface. If traces, metrics, logs and evaluations watch the output side, checking for data drift means watching the input side. So if your service relies on reference documents that change often, simply checking what’s being retrieved on a regular basis can prevent a lot of incidents before they happen.
Here are two scenarios that show how these four elements, together with data drift checks, actually play out.
- Scenario 1: Customer complaint tickets started piling up one day, even though the server error rate and response time looked completely normal. Checking the evaluation metrics showed relevance scores had dropped noticeably over the past few days. Following the trace revealed that a recent change to the knowledge base’s document format had broken the search system’s ability to parse documents correctly, so it was pulling up irrelevant content. The team fixed the parsing logic and added a check so any similar format change would be caught immediately going forward.
- Scenario 2: This month’s AI usage bill came in almost twice as high as expected, even though infrastructure metrics showed nothing unusual. Digging into the cost data revealed that a prompt template used in a specific campaign was unnecessarily repeating a long block of text with every single call. Once the template was cleaned up, costs returned to their normal range.
In both cases, infrastructure metrics like error rate and response time stayed normal the whole time. What actually surfaced the problem was the evaluation metric (relevance score), the trace (the document retrieval process) and the metric tracking cost. The takeaway is simple: you need traces, metrics, logs and evaluations, together with data drift checks, because an AI system can still be producing wrong answers at the exact moment your infrastructure monitoring says everything is fine, and these are the only things that can catch it.

Why AI Observability Is Suddenly Getting So Much Attention
We’ve covered what AI observability is and how it’s structured. But why is this topic suddenly getting so much attention right now? Layer together three changes that have all been unfolding over the past year or two, and the answer becomes clear.
Adoption Is Accelerating Fast
In a PwC survey, 79% of executives said their company had already adopted AI agents, and Gartner projects that agentic AI will be built into 33% of enterprise software by 2028. Compared with under 1% in 2024, that means going from nearly zero to roughly a third of the market in just four years. This isn’t a handful of early adopters running pilots. It’s a sign that AI is already embedded in day-to-day operations at a large number of companies, and that share is only going to climb faster from here.
Governance Hasn’t Kept Pace With Adoption
Gartner also predicts that more than 40% of agentic AI projects will be canceled by the end of 2027, citing runaway costs, unclear business value and inadequate risk management as the main causes. Risk management overlaps almost exactly with what AI observability covers. In other words, these projects aren’t getting canceled because the technology doesn’t work. It’s that the technology works, but nobody can explain or verify its results. The further adoption outpaces governance, the bigger that cancellation risk becomes.
The Cost Is Already Being Felt
The lawyer’s story we opened with, along with NeuBird AI’s finding that 53% of engineering teams spend more than 40% of their time on incident response, isn’t a warning about some distant future risk. It shows a cost that’s already being paid today. The bill is arriving before the governance is even in place.
Taken together, these three shifts mean that building a governance framework is no longer optional. It’s now just a matter of when. As long as adoption keeps accelerating without anything in place to watch over it, the cost that’s already accumulating can only keep growing.

The Risk of Neglect Looks Different in Every Industry
Leave things as they are without a governance framework in place, and the cost comes back wearing a different face depending on the industry. For some, it shows up as litigation. For others, it hits the bottom line, and for others still, it turns into a safety incident. Here’s how that risk plays out across different industries.
- Financial services: When a chatbot or an automated underwriting agent gives incorrect product information or uses language that regulations don’t allow, that’s a direct legal risk. This is why safety and regulatory compliance get managed most strictly here. Teams typically run every response through automated compliance checks and route anything scoring low or flagged as sensitive to a human reviewer as a second layer.
- Commerce and customer service: Watching cost and response time in real time is the priority. The real challenge is balancing the two, making sure that cutting costs doesn’t come at the expense of accuracy.
- Healthcare: The strictest priority is checking how closely an answer matches the actual source material. Statements that can’t be matched against a source are filtered out before they’re ever shown to a patient, and how strict that threshold should be is usually something decided together with clinical and legal teams in advance.
- Manufacturing and public sector: A wrong call on something like equipment diagnostics or complaint classification can turn into a safety incident or an administrative error. That’s why keeping a record of what a decision was based on matters so much here, in a form that can be pulled up immediately if an audit or a complaint review comes later.
The table below summarizes what to check first in each industry.
| Industry | What to check first | Practical tip |
|---|---|---|
| Financial services | Regulatory compliance, safety | Automated checks on every response, with human review for low-scoring cases |
| Commerce and customer service | Cost efficiency, response time | Surface cost on a daily dashboard so the whole team can see it |
| Healthcare | Whether answers match the source | Block any unverified statement before it reaches the patient |
| Manufacturing and public sector | Whether the reasoning can be reconstructed | Always log the reasoning so it can be explained after the fact |
What to Evaluate and Which Tools to Use
Of the four pillars of AI observability we covered earlier, leaving evaluation entirely to automated scoring is risky. If the grading criteria themselves are wrong, nobody will notice as long as they’re only looking at the automated score. That’s why you need a human review process alongside the tools that support it.
Getting Started With Human Review
Don’t try to review every single conversation from day one. A realistic starting point recommended in practice is 50 to 100 conversations a week. Mix in a few at random for an overall read on quality, a few with low scores or customer complaints as your priority cases and a few unusual patterns as edge cases so you get balanced coverage. A simple scale, like 0 to 3, tends to work better in practice than a finer one like 5 or 10 points, but every point on that scale needs a written definition and an example.
| Score | Definition | Example |
|---|---|---|
| 3 | Factually accurate and fully consistent with the source | Refund policy explained exactly as it appears in the actual policy document |
| 2 | Factually correct but somewhat unclear in wording | Policy is correct, but an exception clause is left out |
| 1 | Partially incorrect or unclear on sourcing | Adds a condition that doesn’t actually exist |
| 0 | Factually wrong or with no traceable source at all | Invents a refund policy that doesn’t exist (hallucination) |
Don’t just look at the final answer. Separate the retrieval step from the generation step so you can pinpoint exactly where a failure occurred. If the final answer scores low but retrieval turned up the right material, the problem lies in the prompt design or summarization, not the AI’s writing ability. Making that distinction keeps you from spending your budget in the wrong place, like switching to a more expensive model when that was never the issue. Whatever failures you find this way should go straight into a running test list you can use to check whether the same problem shows up again.
Once this process is running smoothly, you can extend it by handing the same rubric to an AI judge, an approach known as LLM-as-judge. The key here, too, is not to ask vaguely whether an answer is good. Have the model score it against the rubric above and explain why it landed on that score.
Narrowing Down the Right Tool
- Are you already built on a specific development framework, such as LangChain or LangGraph? If so, start with the tool that integrates most easily.
- Is it acceptable to store conversation data on a third-party vendor’s servers? If data sovereignty is a sensitive issue, prioritize open-source options you can self-host.
- Is your most urgent need logging and tracing or automated scoring? Choose a tool built for logging in the first case and one built for evaluation in the second.
| Tool | Format | What it’s known for |
|---|---|---|
| Langfuse | Open source (self-hostable) | Detailed logging and tracing, compatible with a wide range of frameworks |
| LangSmith | Commercial (LangChain) | Integrates instantly with no setup if you’re already on LangChain |
| Braintrust | Commercial | Built around evaluation, with automatic prompt improvement suggestions |
| Arize AX + Phoenix | Enterprise plus open source | The deepest evaluation features, including support for voice services |
| MLflow | Fully open source | Full data ownership, no separate licensing cost |
| Datadog LLM Observability | Extension of an existing monitoring tool | Manages infrastructure monitoring and AI signals together in one view |
If you’re already on LangChain, for instance, LangSmith takes the least effort to set up. If data sovereignty or cost is your main concern, it makes sense to start with an open-source option like Langfuse or MLflow and move to a paid product once your traffic grows. If you’re already managing infrastructure with Datadog, Datadog LLM Observability lets you see everything in one place, and if automating evaluation and improvement is your top priority, Braintrust or Arize is the better fit. Open-source tools can typically start collecting data the same day with just a few lines of code, while integrating with an existing monitoring tool usually requires coordinating with the team that owns it, which often adds one to two weeks to your setup time.
Execution Roadmap: A Step-by-Step Checklist
Once you’ve decided what to look at and how, all that’s left is the order of operations. Rather than a grand roadmap, here’s something simple you can actually follow starting this week.
Week 1: Ask Three Questions and Start Logging
- What kind of failure would hurt our business the most
- What counts as a bad answer
- What we want visibility into first
Settle on answers to these three questions within your team first. Without them, no tool, however good, will tell you what to look at. Pick just one or two of your most-used AI features to start, and connect a basic logging tool that captures what questions came in and what answers went out. That’s enough to get moving.
Weeks 2 to 3: Start Human Scoring
Pull 50 to 100 conversations a week using a mix of random sampling, priority cases and unusual patterns, and score them against the 0 to 3 rubric your team has agreed on. During this stage, focus less on automation and more on building consensus around what a good answer actually looks like at your organization.
Weeks 4 to 6: Extend Into Automated Evaluation
Using the human scores from weeks 2 and 3 as a baseline, check whether an AI judge reaches similar conclusions. Log any failure pattern that keeps showing up so you can keep tracking it, and add an automated check into your deployment pipeline so a new version can’t ship if it fails to meet your quality bar.
Week 7 Onward: Establish Governance
If your industry requires audit readiness, define how long records are retained and who can access them, and set up automatic alerts for whenever a given metric drops below your threshold. Revisit the rubric itself every quarter, since your standard for a good answer should evolve as your service does. Decide ahead of time who owns speed and cost, who owns quality and who owns regulatory response, so you don’t lose time figuring out who’s responsible for a fix after a problem has already been found.
| Timeline | Key goal | Completion criteria |
|---|---|---|
| Week 1 | Settle on three priority questions and start logging | Conversation logs accumulating for one or two key features |
| Weeks 2 to 3 | Human scoring, rubric agreed | 0 to 3 rubric documented internally, 50 to 100 conversations scored weekly |
| Weeks 4 to 6 | Extend into automated evaluation | AI scoring and pre-deployment checks both running |
| Week 7 onward | Governance in place | Record retention, alerts and quarterly review all running |
Whether to follow this roadmap should come down to how much responsibility your AI is carrying, not the size of your company. If you’re exposing AI responses directly to customers, letting AI handle real transactions like payments, booking changes or data updates, operating in a regulated industry or running and comparing multiple models at once, there’s no reason to wait even if you’re a startup. On the other hand, if a large enterprise is still at the internal experimentation stage, the lightweight logging described in week one is enough for now.
Common Challenges During Adoption and How to Get Past Them
If you’ve read this far, you’ve probably already sensed it: the hardest part of adopting AI observability isn’t wiring up the tools. It’s figuring out the right scoring criteria for your own organization. You won’t find that answer in a manual. The experience of people who have already been through a similar rollout makes a real difference. Gartner analyst Byrne has pointed out that trying to solve this entirely in-house, without a standardized observability framework, tends to drag out incident resolution and pile on manual work. In fact, the same survey mentioned earlier found that 40% of organizations spend a significant share of their engineering time managing incidents. Leaving that burden entirely on internal staff isn’t sustainable.
This challenge tends to loom even larger for organizations without a dedicated AI lead or with a development team that has never had to manage AI quality before. Picking the wrong tool and having to rip it out later or setting the bar too low and only finding out after something has gone wrong both cost real time and money.
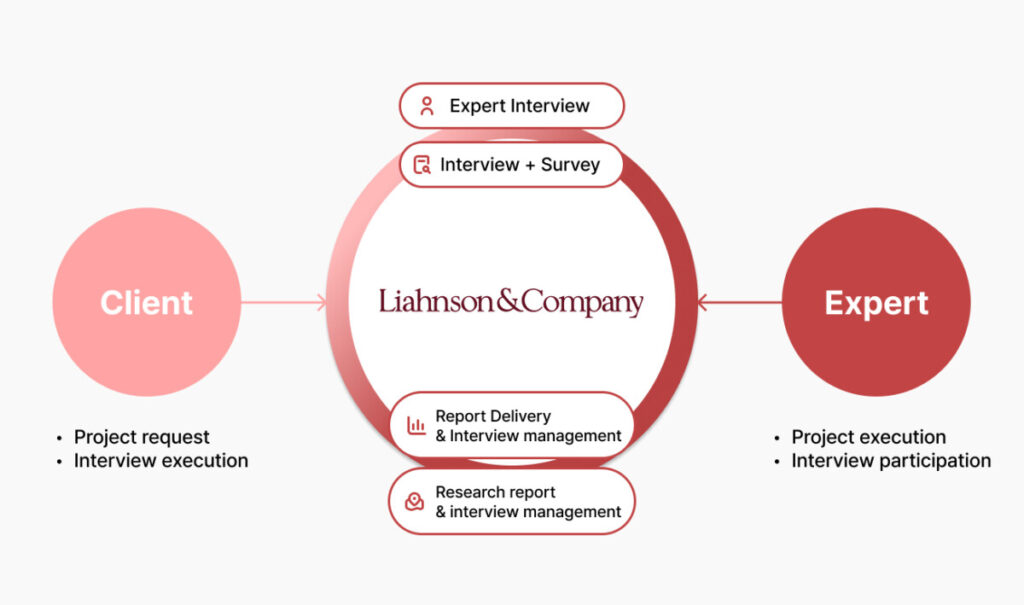
Liahnson & Company‘s expert network connects companies with people who have that kind of hands-on experience. Advisory sessions typically cover ground you won’t find in a manual or get from AI alone: where to set the bar for your organization’s specific risk level, how many conversations a week organizations of a similar size are actually scoring by hand, which tools behaved differently than expected in practice and what kind of records were actually required during an audit or a regulatory review. Do you need real expert help building AI observability the right way? Tell Liahnson & Company what you need, and with a database of over six million experts, we’ll match you with the right one within 48 hours.
Conclusion
AI observability is a subject no company can avoid once it moves from experimenting with AI to actually being responsible for running it. With agentic AI adoption already outpacing governance, closing that gap only gets more expensive the longer it’s put off. If hallucination is an inherent trait of LLMs, the best thing we can do isn’t trying to eliminate it. It’s building a system of records and evaluation that lets us trace, at any time, what an answer was based on.
What matters isn’t building a perfect system from day one. It’s starting with a single small log in week one, running it through human judgment and gradually widening the scope of automation from there. Organizations that follow this order tend to see it translate into real quality improvements, not just another tool sitting on a shelf. Start applying the methods and checklist covered in this article one at a time, starting this week, and if you get stuck putting together the standard that fits your organization, reach out to Liahnson & Company’s expert network first and talk to someone who has actually been through this before.
In the end, all of this serves one purpose: making sure both your customers and your company can trust the answers AI gives with confidence.

Source
https://www.marktechpost.com/2026/08/09/top-llm-observability-and-evaluation-platforms-in-2026-langfuse-langsmith-braintrust-arize-and-more-compared/https://www.gartner.com/en/newsroom/press-releases/2025-06-25-gartner-predicts-over-40-percent-of-agentic-ai-projects-will-be-canceled-by-end-of-2027https://www.gartner.com/en/newsroom/press-releases/2026-05-12-gartner-predicts-40-percent-of-organizations-deploying-ai-will-use-ai-observability-to-monitor-model-performance-by-2028https://naturalandartificiallaw.com/uk-ai-hallucination-cases-tracker/https://www.databricks.com/blog/best-practices-and-methods-llm-evaluationhttps://futureagi.com/blog/model-vs-data-drift-how-to-identify-and-handle-it/https://www.braintrust.dev/articles/human-in-the-loop-evals-for-llm-apps